What is 'Packet, where are you?' - Meet pwru!
If you are into Linux and networking, Peru 🇵🇪 will never just be a country again.
The project #
Packet, where are you?, pwru - pronounced ‘Peru’ - is an 🐝 eBPF
tool that traces network packets going through the Linux Kernel networking stack.
It uses Kernel probes (kprobes)
to attach to the relevant kernel functions and intercept packets.

10K-foot view #
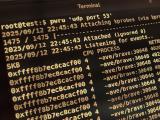
With pwru you can get packet traces like this:
2025/09/17 23:34:24 Attaching kprobes (via kprobe-multi)...
1475 / 1475 [---------------------------------------------------------------------------------------------------------------------------------------------------------------------------------------] 100.00% ? p/s
2025/09/17 23:34:24 Attached (ignored 0)
2025/09/17 23:34:24 Listening for events..
SKB                CPU PROCESS          NETNS      MARK/x        IFACE       PROTO  MTU   LEN   TUPLE FUNC
0xffff8b7d9462c600 3   ~bin/ping:123382 4026531840 0               0         0x0000 1500  84    192.168.1.39:0->8.8.8.8:0(icmp) __ip_local_out
0xffff8b7d9462c600 3   ~bin/ping:123382 4026531840 0               0         0x0800 1500  84    192.168.1.39:0->8.8.8.8:0(icmp) nf_hook_slow
0xffff8b7d9462c600 3   ~bin/ping:123382 4026531840 0               0         0x0800 1500  84    192.168.1.39:0->8.8.8.8:0(icmp) sk_skb_reason_drop(SKB_DROP_REASON_NETFILTER_DROP)
0xffff8b7d9462c600 3   ~bin/ping:123382 4026531840 0               0         0x0800 1500  84    192.168.1.39:0->8.8.8.8:0(icmp) skb_release_head_state
0xffff8b7d9462c600 3   ~bin/ping:123382 4026531840 0               0         0x0800 0     84    192.168.1.39:0->8.8.8.8:0(icmp) sock_wfree
0xffff8b7d9462c600 3   ~bin/ping:123382 4026531840 0               0         0x0800 0     84    192.168.1.39:0->8.8.8.8:0(icmp) skb_release_data
0xffff8b7d9462c600 3   ~bin/ping:123382 4026531840 0               0         0x0800 0     84    192.168.1.39:0->8.8.8.8:0(icmp) skb_free_head
0xffff8b7d9462c600 3   ~bin/ping:123382 4026531840 0               0         0x0800 0     84    192.168.1.39:0->8.8.8.8:0(icmp) kfree_skbmem
The project’s main GitHub page has a short demo (GIF).
pwru can help you:
- debug packet drops (e.g. iptables/nftables, checksums, MTU, routing, RPF…).
- debug eBPF programs.
- troubleshoot complex networking setups (e.g. K8s CNIs, docker networks, multiple network NSs in general..).
- profile / identify bottlenecks in your network stack.
A short intro tutorial #
I put together a brief ~10min tutorial:
Getting started with pwru
11 mins
An introduction to the power of ‘Packet, where are you?’ - pwru to debug and troubleshoot networking issues in Linux.
My Aha! moment… #
I must confess: some 16 months ago, right before joining Isovalent and getting a bit more involved
with Cilium, I had no clue what pwru was or even that it existed 🫠.
My two first thoughts were:
- Auch… that would have saved me (more than) a few hours debugging tricky RPF, MTU and other routing issues in the past.
- Why have I never come across
pwrubefore?
So, yeah… let’s fix that. Spread the word 📢!